1.1 資料分析-統計
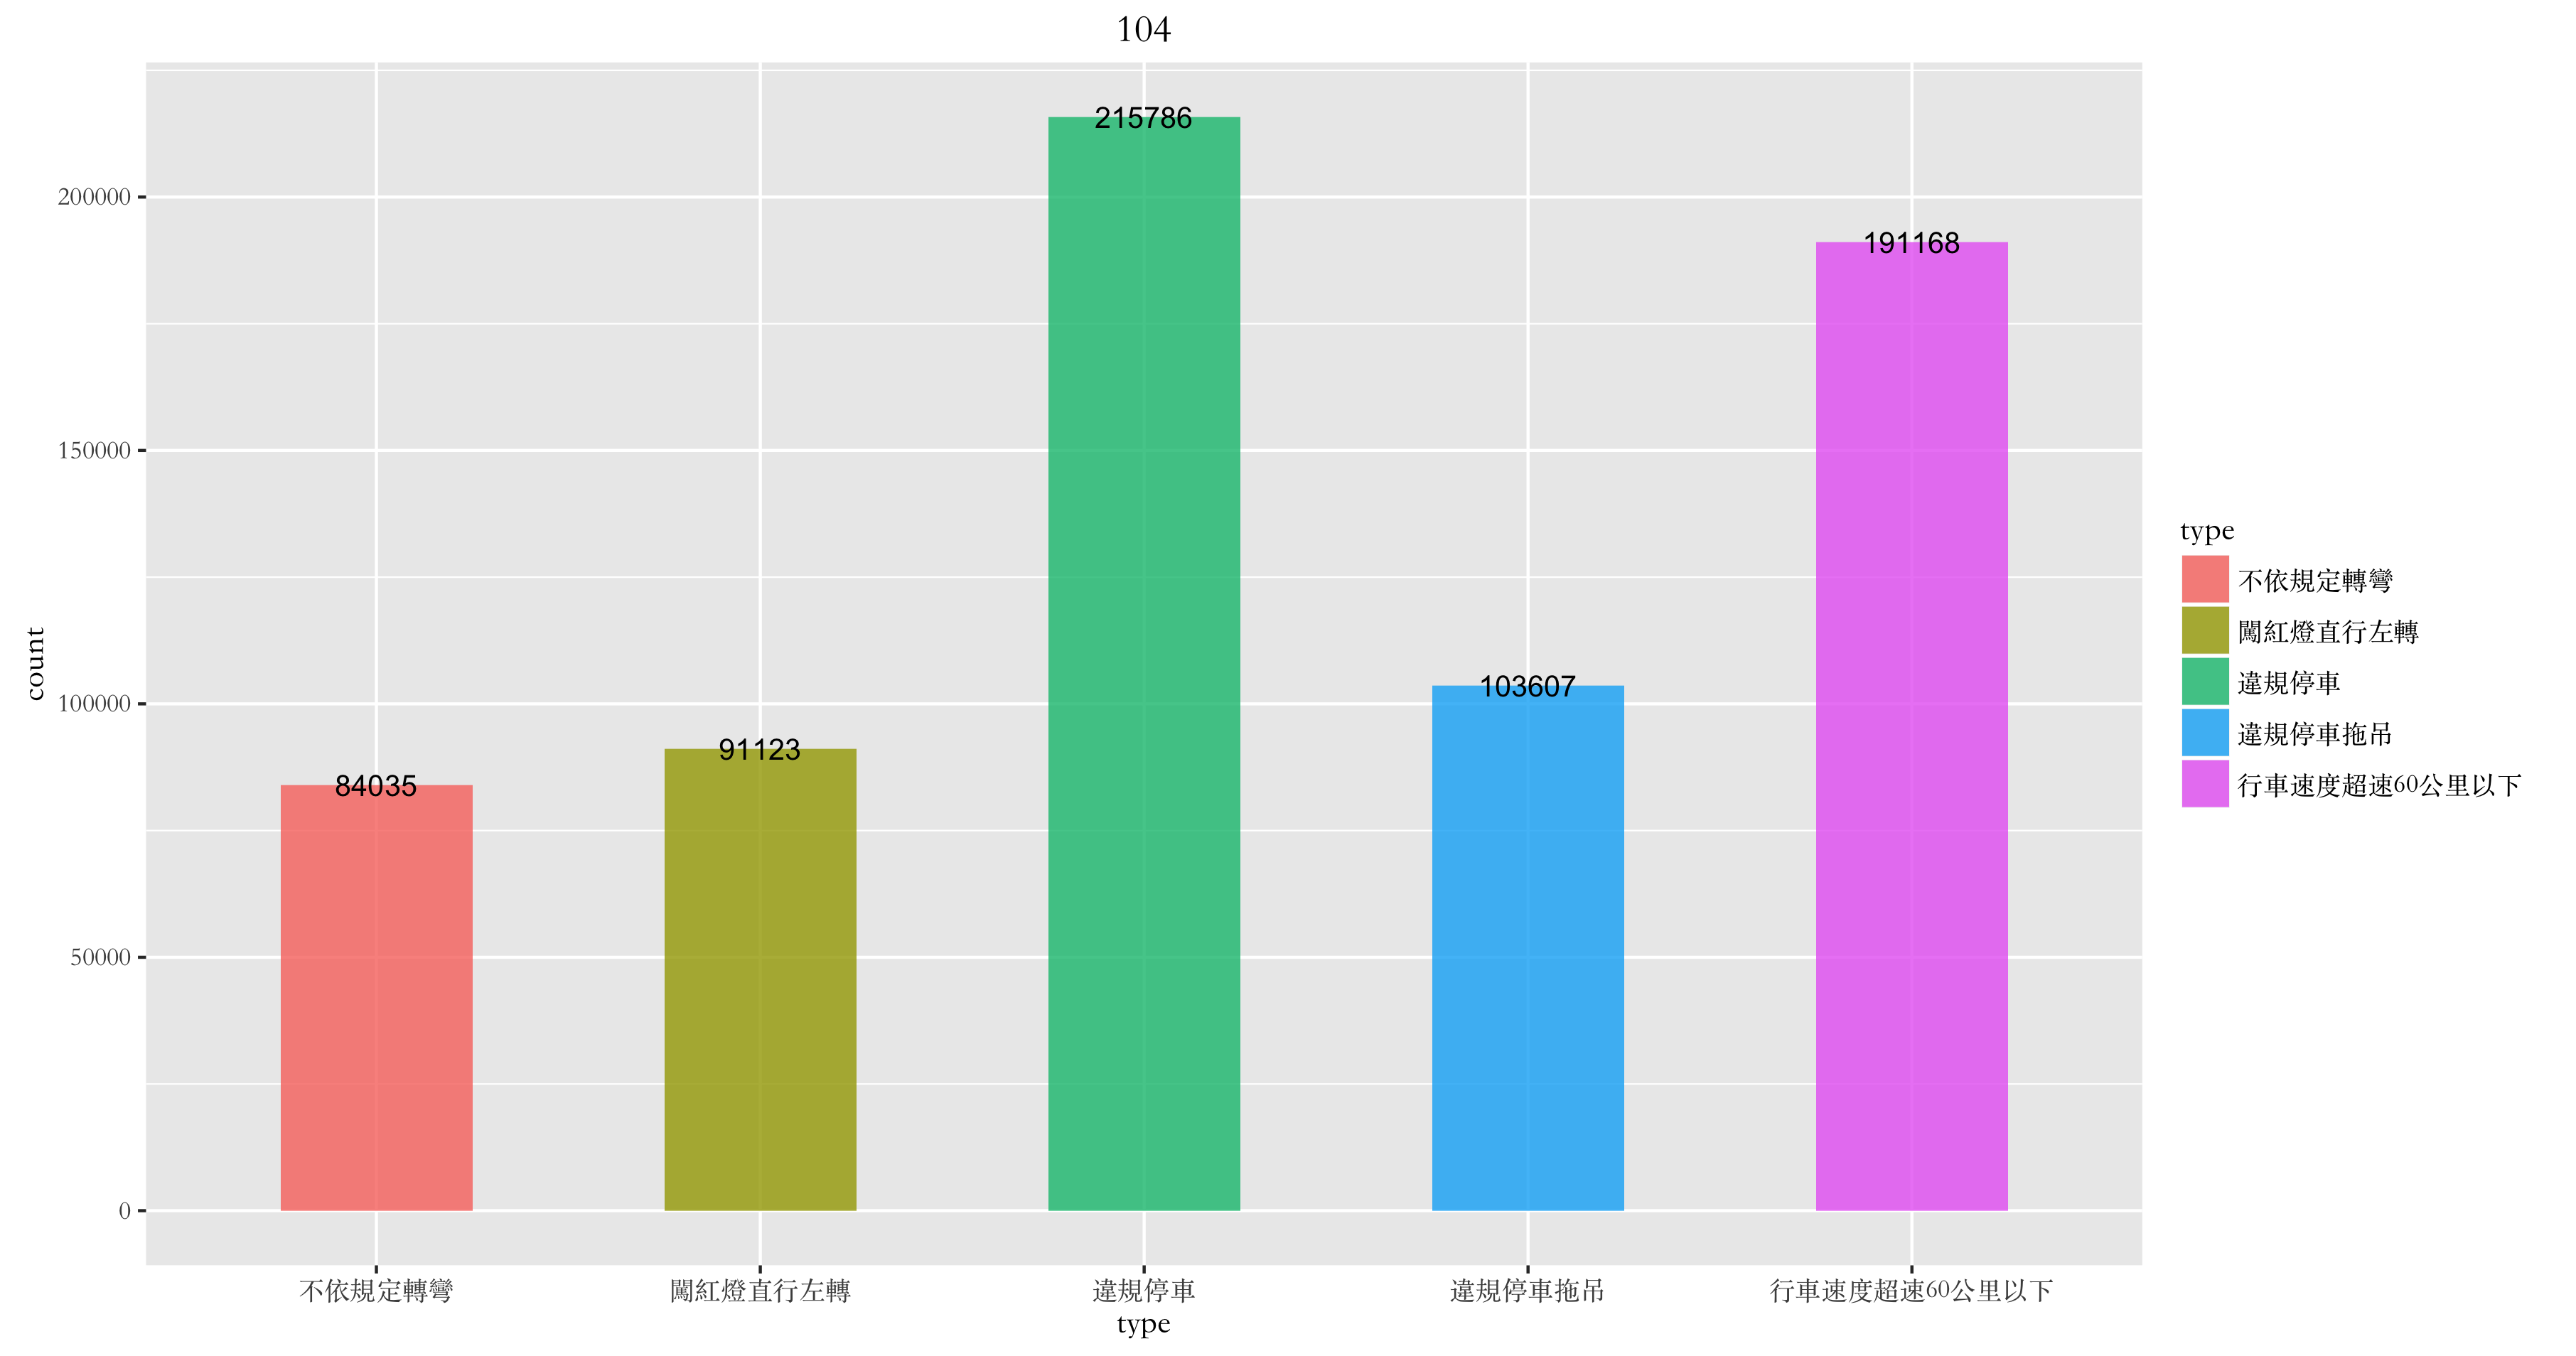
首先,針對前五種舉發種類(不依規定轉彎、闖紅燈直行左轉、違規停車、違規停車拖吊、行車速度超速60公里以下)的長條圖分析:
ggplot(type[1:5,],aes(x=type,y =count,fill = type))+
  geom_bar(stat="identity",width=.5,alpha = 0.8) +
  geom_text(aes(label = count),size = 3.5) +
  ggtitle("104") +
  theme(text = element_text(family = "Songti SC"))
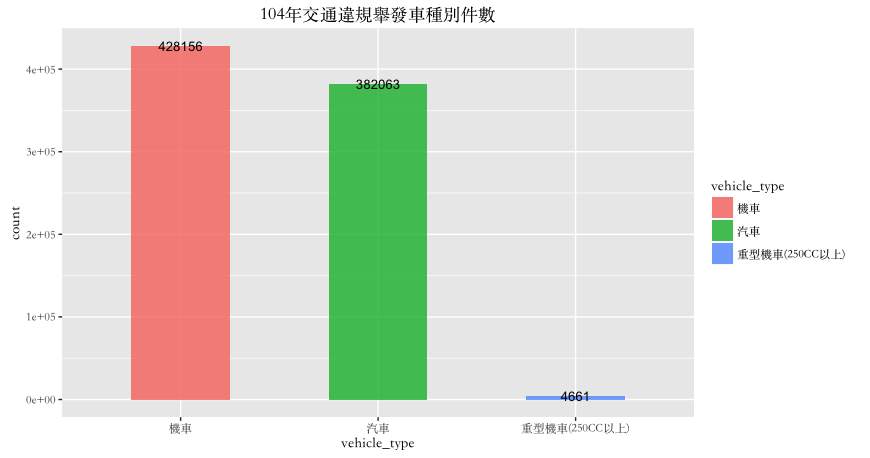
 針對舉發車種別的件數統計:
ggplot(vtype,aes(x=vehicle_type,y =count,fill = vehicle_type))+
  geom_bar(stat="identity",width=.5,alpha = 0.8) +
  geom_text(aes(label = count),size = 3.5) +
  ggtitle("104年交通違規舉發車種別件數") +
  theme(text = element_text(family = "Songti SC"))
 針對逕舉還是攔停的舉發方式的統計:
ggplot(method,aes(x=method,y =count,fill = method))+
  geom_bar(stat="identity",width=.5,alpha = 0.8) +
  geom_text(aes(label = count),size = 3.5) +
  ggtitle("104年交通違規舉發方式別件數")  +
  theme(text = element_text(family = "Songti SC"))
針對前五舉發種類的盒鬚圖:
top5type <- type[1:5,1]#取出數量前五的種類
top5 <- data.frame()#產生空的框架
for(i in 1:5){
  X <- type_month %>%
    filter(type == as.character(top5type[i,]))
  top5 <- rbind(top5,X)
}#重新取出數量前五種類的資料

ggplot(top5,aes(x=type,y =count,fill = type))+
  geom_boxplot(alpha = 0.7) +
  ggtitle("104年交通違規盒鬚圖") +
theme(text = element_text(family = "Songti SC"))
#畫出盒鬚圖