1.2 資料分析-月份趨勢
針對前五舉發種類,我們產生每個月的長條圖統計:
bar <- list()#產生空的list
for(i in 1:12){
  X <- ungroup(top5) %>%
    filter(month == i)
  bar[[i]]<- ggplot(X,aes(x=type,y =count,fill = type))+
    geom_bar(stat="identity",width=.5,alpha = 0.8) +
    geom_text(aes(label = count),size = 3.5) +
    ggtitle(paste("104年",i,"月交通違規舉發")) +
    theme(text = element_text(family = "Songti SC"))
  print(bar[[i]] )

}#產生1至12月的bars
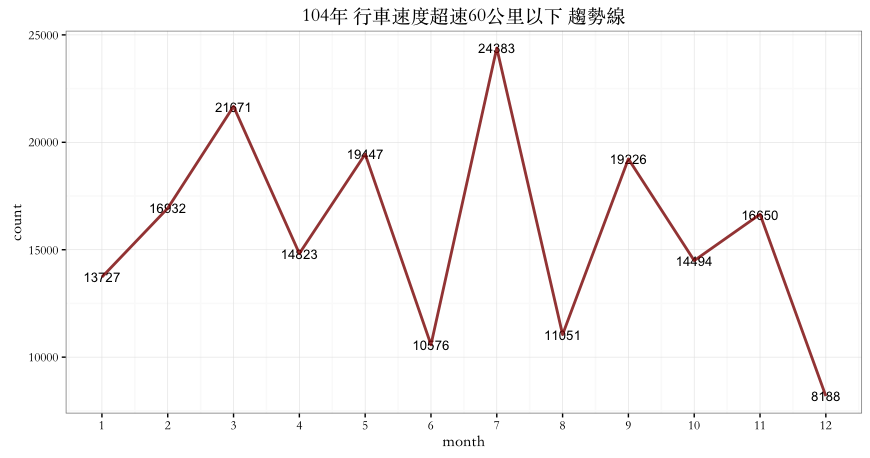
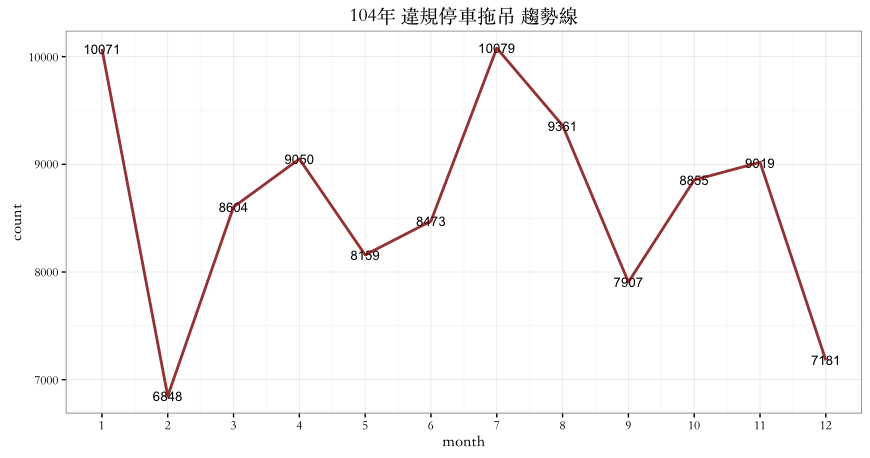
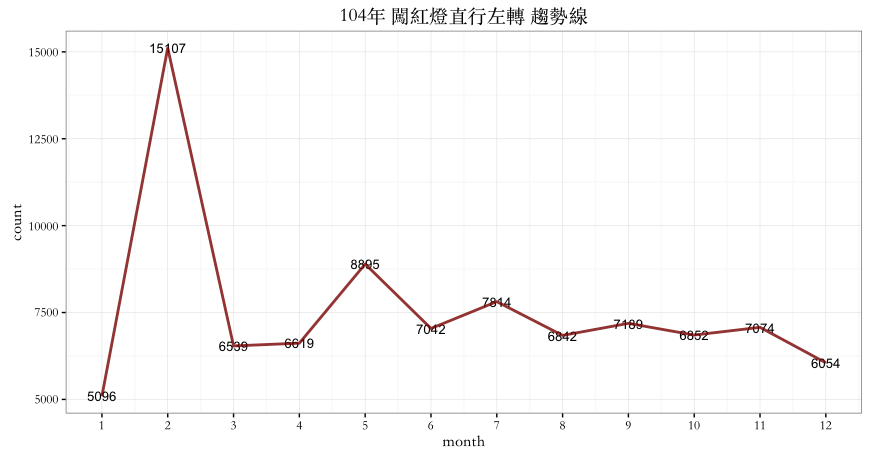
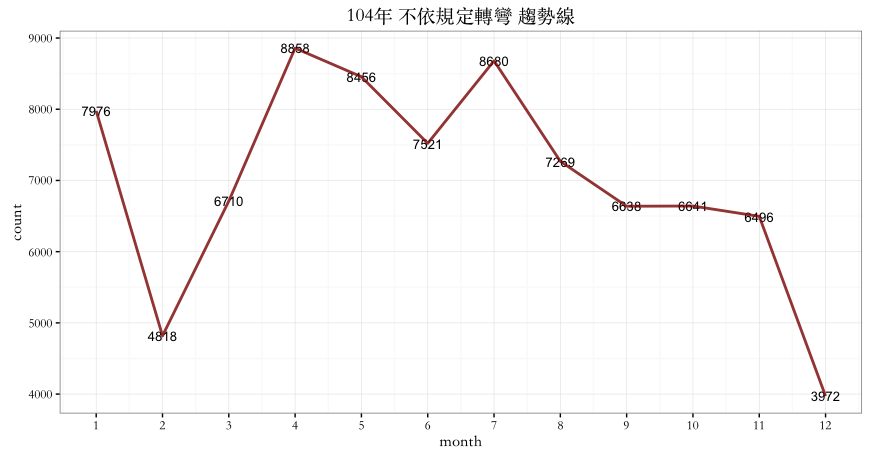
前五舉發種類的各月份趨勢圖:
trendline <- list()
for(i in 1:5){
   X <- ungroup(top5) %>%
    filter(type == as.character(top5type[i,]))
  trendline[[i]] <- ggplot(X,aes(x=month,y =count))+
    geom_text(aes(label = count),size = 3.5) +
    geom_line(colour = "darkred",size = 1,alpha=0.8) +
    scale_x_continuous(breaks = 1:12) +
    theme_bw() +
    ggtitle(paste("104年",as.character(top5type[i,]),"趨勢線")) +
    theme(text = element_text(family = "Songti SC"))
  print(trendline[[i]] )

}
#產生前5種類的trendllines

 交通違規總數的月份趨勢圖:
month <- data %>%
  filter(year == 104) %>%
  group_by(month) %>%
  summarise(count = sum(count)) %>%
  arrange(desc(count))
ggplot(month,aes(x=month,y =count))+
  geom_text(aes(label = count),size = 3.5) +
  geom_line(colour = "darkred",size = 1,alpha=0.8) +
  scale_x_continuous(breaks = 1:12) +
  theme_bw() +
  ggtitle(paste("104年交通違規總數趨勢線"))  +
  theme(text = element_text(family = "Songti SC"))
針對車種的各月份趨勢圖:
ggplot(vtype_month,aes(x=month,y =count,colour=vehicle_type))+
  geom_text(aes(label = count),size = 3.5) +
  geom_line(size = 1,alpha=0.8) +
  scale_x_continuous(breaks = 1:12) +
  theme_bw() +
  ggtitle(paste("104年交通違規車種趨勢線")) +
  theme(text = element_text(family = "Songti SC"))
舉發方式的各月份趨勢圖:
ggplot(method_month,aes(x=month,y =count,colour=method))+
  geom_text(aes(label = count),size = 3.5) +
  geom_line(size = 1,alpha=0.8) +
  scale_x_continuous(breaks = 1:12) +
  theme_bw() +
  ggtitle(paste("104年交通違規舉發方式趨勢線")) +
    theme(text = element_text(family = "Songti SC"))
最後,我們針對前五種類的舉發種類與各月份做了熱度圖:
ggplot(ungroup(top5),aes(x=factor(month), y=factor(type), fill=count)) +
 geom_tile(color="white", size=0.1) +
 scale_fill_viridis(name="件數")+ #使用viridis
 coord_equal()+
 labs(x=NULL, y=NULL, title="104年交通違規熱度圖")+
 theme_tufte(base_family="Helvetica")+ #使用ggthemes
 theme(plot.title=element_text(hjust=0))+
 theme(axis.ticks=element_blank())+
 theme(axis.text=element_text(size=7))+
 theme(legend.title=element_text(size=8))+
 theme(legend.text=element_text(size=6)) +
  theme(text = element_text(family = "Songti SC"))

#熱度圖